How do I start the kernel debugger?
The master's answer:
There is one very important component in the software development process - debugging. In relation to application programs, it is carried out by means that run in user mode and are often built into the IDE. In order to be able to debug, for example, drivers, you need to run the kernel debugger.
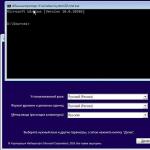
You need to start the command processor cmd. Open the Start menu on the taskbar. In the window that appears, click on the "Run ..." item. The "Run Program" window will appear. Enter cmd in the text box, then click OK.
Now back up the boot.ini file. First, find out the installation path of the current copy of Windows using the command: echo% SystemRoot%
Next, go to the disk with the installed operating system by entering the device letters, and after them, putting a colon. Using the cd command, change to the root directory. Now use the attrib command to remove the hidden, read-only, and system attributes from the boot.ini file. Use the copy command to create a backup and then set the attributes in place.
To display the current list of boot options, use the bootcfg / query command. Review the list to determine which element will be used to build the new kernel debuggable settings. The Boot Record ID should be remembered.
Use the bootcfg / copy command to create a boot record. Use the / id parameter to specify the identifier of the entry to be copied. Using the / d parameter, specify the name of the entry to be displayed. Now you need to go back to the list of boot options using the bootcfg / query command and look at the ID of the added entry.
Now you need to include options to run the kernel debugger in the previously created boot record. If you will be debugging on the target machine, you just need to add the / debug option.
If you want to perform remote debugging with the target computer connected via the com port to the host machine, then use the / port and / baud options to specify the port number and baud rate.
If you are going to perform remote debugging using a FireWire cable (IEEE 1394 interface), then use the / dbg1394 option to enable the appropriate mode and / ch to specify the channel number.
To verify that the changes have been made, test the boot files using the bootcfg command with the / query parameter. Close the shell window after issuing the exit command.
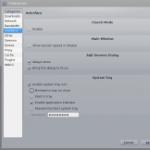
Change the boot parameters of the operating system if necessary. Open the control panel through the "Start" menu, and already in it, open the "System" item. In the "System Properties" window that opens, select the "Advanced" tab. In this tab, select the section titled "Startup and Recovery" and in it click on the "Options" button. In the "Startup and Recovery" window that appears, you need to activate the "Display a list of operating systems" option. Close both dialog boxes with the "OK" button.
Restart your computer. Select boot with debugger. Log in and start working on the target machine or start remote debugging. Use tools like WinDbg and KD.
This series of articles appeared for two reasons. Firstly, I like working with the project HackSysExtremeVulnerableDriver... Secondly, I got a lot of wishes to highlight this topic.
All the code used in writing this series is in my repository.
In this series of articles, we will look at writing kernel-level exploits in Windows. It is important to note that we will be dealing with known vulnerabilities and there is no need for reverse engineering (at least for the driver).
After reading all the articles, it is expected that you will know all the most common vulnerability classes and exploitation methods, and will also be able to port exploits from x86 architecture to x64 architecture (if possible) and familiarize yourself with the new protection methods in Windows 10.
Kernel debugging diagram
Unlike user-level debugging, when the execution of an individual process is suspended, the whole system is involved at the kernel level, and we cannot use this method. Accordingly, you need a separate debugging machine that can communicate with the system where the kernel is being debugged, view memory and kernel structures, and catch system crashes.
Additional material to study:
Exploiting kernel vulnerabilities
This process is much more fun than user J-level exploitation.
The main goal is to achieve privileged execution in the context of the kernel. And then everything depends on our imagination, from a feast with home-brewed beer to the introduction of state-sponsored malware.
In general, our task is to get a shell with system privileges.
Topics for this series
- Part 1: Setting up the working environment
- Configuring three virtual machines and a system that will act as a debugger.
- Configuring the WinDBG Debugger.
- Part 2: Payloads
- Examining the most common payloads. Subsequent parts will address specific vulnerabilities and provide links to this article as appropriate.
- The rest of the parts.
- Consideration of vulnerabilities.
Kernel-level exploit development lifecycle
- Finding the vulnerability... This topic will not be covered in this series, since we already know exactly where the holes are.
- Interception of the thread of execution... Some vulnerabilities involve code execution, some have additional requirements.
- Extension of privileges... The main goal is to get a shell with system privileges.
- Restoring the flow of execution... Uncounted exceptions at the kernel level cause the system to crash. If you are not going to write a DoS exploit, this fact should be considered.
Types of target systems
We will work with vulnerabilities in the following systems (the specific version is not important):
- Win7 x86 VM
- Win7 x64 VM
- Win10 x64 VM
Let's start with the x86 architecture, and then we will port the exploit to the Win7 x64 system. Some exploits will not run on Win10 machines due to the new protections present. In this case, we will either change the logic of the exploit, or we will use a completely different approach.
Software used:
- Hypervisor (lots of options).
- Windows 7 x86 VM
- Windows 7 x64 VM
- Windows 10 x64 VM
Setting up systems for debugging
The debug systems we will interact with are designed to load a vulnerable driver. These machines will crash frequently, as most kernel exceptions contribute to this kind of behavior. You need to allocate enough RAM for these systems.
On each machine that will be debugged, you need to do the following:
- Inside the VirtualKD directory, run target \ vminstall.exe. A new boot record will be added and debugging functions and automatic connection to the VirtualKD server installed on the system that acts as a debugger will be available.
In the case of Windows 10 VM, you need to enable the test signing mode, which allows you to load unsigned drivers into the kernel.
After running the bcdedit / set testsinging on command and rebooting, “Test Mode” appears on the desktop.
Brief description of the HEVD module
The DriverEntry procedure is the starting procedure for each driver:
NTSTATUS DriverEntry (IN PDRIVER_OBJECT DriverObject, IN PUNICODE_STRING RegistryPath) (
UINT32 i = 0;
PDEVICE_OBJECT DeviceObject = NULL;
NTSTATUS Status = STATUS_UNSUCCESSFUL;
UNICODE_STRING DeviceName, DosDeviceName = (0);
UNREFERENCED_PARAMETER (RegistryPath);
PAGED_CODE ();
RtlInitUnicodeString (& DeviceName, L "\\ Device \\ HackSysExtremeVulnerableDriver");
RtlInitUnicodeString (& DosDeviceName, L "\\ DosDevices \\ HackSysExtremeVulnerableDriver");
// Create the device
Status = IoCreateDevice (DriverObject,
0,
& DeviceName,
FILE_DEVICE_UNKNOWN,
FILE_DEVICE_SECURE_OPEN,
FALSE,
& DeviceObject);
- This procedure contains a call to the IoCreateDevice function containing the driver name that we will use during communication.
- The required structures and function pointers will be added to the DriverObject.
- The important thing for us is the function pointer associated with the DriverObject-> MajorFunction procedure, which is responsible for handling the IOCTL (I / O Control; I / O control);
- HEVD calls this function IrpDeviceIoCtlHandler, which is a large conditional expression with many branches for each IOCTL. Each vulnerability has a unique IOCTL.
Example: HACKSYS_EVD_IOCTL_STACK_OVERFLOW is an IOCTL used to activate a stack overflow vulnerability.
This concludes the first part. In the next article, we'll talk about payloads. At the moment, only the payload designed to steal tokens is available, which will be used in the third part.
P.S. I understand that there are many subtleties and problems that you may encounter. Since this cycle focuses on developing exploits, you will have to solve all the associated problems yourself. However, you can ask all the questions that arise in the comments.
- Authors:
Barinov S.S., Shevchenko O.G.
- Year:
- A source:
Informatics and computer technologies / Materials of the VI international scientific and technical conference of students, graduate students and young scientists - November 23-25, 2010, Donetsk, DonNTU. - 2010 .-- 448 p.
annotation
A comparative analysis of debugging of user mode and kernel mode in relation to the Microsoft Windows operating system is given, the differences and problems of organizing debugging of the latter are highlighted. Based on the results obtained, the main requirements for the construction of kernel-mode debuggers in the case of emergency and interactive debugging are formulated. The analysis of existing solutions for compliance with the requirements was carried out. In particular, special attention is paid to the Microsoft Windows Debugger.
Main part
Debugging is the process of identifying and fixing the root cause of software errors. In some projects, debugging takes up to 50% of the total development time. Debugging can be greatly simplified by using specialized tools that are constantly being improved. The main such tool is a debugger, which allows you to control the execution of software, monitor its progress and intervene in it. Kernel debugging tools are primarily used by driver developers.
The application software development toolkit offers the programmer a wide range of possibilities. Any integrated development environment also includes the ability to debug without the need for third-party utilities. If we are talking about system software and driver development in particular, then due to its specifics, the development process is extremely difficult and little automated. All development phases, including debugging, are separate. To carry out each of them, special conditions are required: programming code is written on a full-fledged computer system, debugging - on a debugging system, testing - depending on the circumstances, etc. The kernel-mode debugger itself is more difficult to learn and, accordingly, less user-friendly.
In general, we can talk about a lack of kernel debugging tools. While such tools are available, there is often no need to talk about alternatives. For example, the Microsoft Windows Debugger has an entry threshold too high. Many programmers talk about the first negative experience when meeting with it, and most of its capabilities remain unsolicited.
Based on the structure of the virtual address space, if an error is made in the application, as a result of which the application will write data to an arbitrary memory location, then the application will damage only its own memory and will not affect the operation of other applications and the operating system. Whereas the kernel-mode code is able to damage important data structures of the operating system, which will inevitably lead to a general failure. An ineffectively written driver can also cause serious degradation of the entire operating system.
- Modern debuggers provide the following basic functionality:
- debugging at the source code level;
- execution control;
- viewing and changing memory;
- viewing and changing the contents of processor registers;
- view the call stack.
To make it easier to work with disassembled code, so-called. debug symbols. While the linker is running, in addition to the image of the executable file, a data file can also be created that contains information that is not required when executing the program, but is extremely useful for debugging it: names of functions, global variables, description of structures. Debug symbols are available for all executable files of the Windows operating system.
Execution control refers to the ability to interrupt and resume the execution of the program code upon reaching a given instruction in the program code. If the program code is executed in a step-by-step mode, an interrupt occurs for each token of the programming language or when exiting a subroutine. With free execution, an interrupt occurs in predetermined sections of the code - the places where breakpoints are set.
Interrupting the kernel mode code presents the following dilemma. The debugger uses the user interface to interact with the programmer. Those. at least the visible part of the debugger runs in user mode and naturally uses the application programming interface (Windows API) to build it, which in turn relies on kernel mode modules. Thus, suspending kernel-mode code can lead to a deadlock: the system will stop responding to user requests.
To access kernel memory, the debugger parts must also run in kernel mode. This leads to the emergence of two problems at once, which are an obvious consequence of organizing memory in the protected mode of the processor.
The first problem concerns translation of virtual memory addresses. Drivers constantly interact with user-mode applications by accessing their memory. The Windows operating system translates virtual addresses into physical addresses, guided by the concept of thread context. A stream context is a structure that reflects the state of a stream and includes, in particular, a set of registers and some other information. When control is transferred to another thread, a context switch occurs, in which information about one thread is saved and information about another is restored. When the context of a thread switches to a thread of another process, the page directory used to translate virtual addresses to physical addresses is also switched.
The peculiarity is that when dispatching system calls, the Windows operating system does not switch the context. This allows kernel-mode code to use user-mode virtual addresses.
The situation is different when dispatching interrupts or executing system threads. An interruption can occur at any time, so you cannot predict which thread context will be used. System threads, on the other hand, do not belong to any process and cannot translate user-mode virtual addresses. It follows that in these situations it is not possible to access the user mode memory.
The second problem is access to relocatable memory. Most of the information in memory is relocatable and can be moved from physical memory to hard disk into a page file at any time. If you access a page that is not in physical memory, the processor normally generates a Page Fault interrupt, which will be handled by the memory manager, and as a result, the page will be read from the page file and loaded into physical memory.
This behavior is broken if the debugger code is forced to use high interrupt request levels (IRQL). If the IRQL matches or exceeds the IRQL of the memory manager, the latter will not be able to load the missing page, because the operating system will block the Page Fault interrupt. This will crash the operating system.
Debugging is usually divided into interactive and emergency. In interactive local debugging, the debugger runs on the same system as the debug object. In interactive remote debugging, the debugger and the debug object run on different systems. When debugging the kernel code, the system must be monitored starting from the first stages of its boot, when the network is not yet functioning, therefore, simple serial interfaces such as COM, FireWire, USB are used to communicate systems. Recently, due to the trends in the development of software virtualization at different levels of abstraction, virtual machines are increasingly attracted. The guest OS acts as the debugger OS, the hosted OS includes the debugger user interface.
Thus, emergency debugging does not require the debugging tool to be installed on the test machine. The distribution of the Windows operating system includes mechanisms for implementing emergency debugging. Before rebooting, the operating system can save information about its state, which the developer can analyze and find out the cause. This information stored in a file is called a memory dump.
Basic kernel-mode debugging tools are provided by the Windows operating system manufacturer as part of the Debugging Tools for Windows freeware package. The tools include the WinDbg and KD graphical and console debuggers, respectively (hereinafter referred to as Windows Debugger). The work of these debuggers relies on mechanisms provided by the developers of the operating system and embedded in its kernel.
The main mode for Windows Debugger is command interpreter mode. Due to its modular structure, along with the commands supplied by the developers, Windows Debugger supports third-party modules called extensions. In fact, most of the built-in commands are also provided as extensions.
Windows Debugger is focused on remote interactive and emergency debugging, when used, all of its capabilities are revealed. At the same time, full-fledged local interactive debugging is not supported: the debugger only allows you to view some of the kernel structures.
There is a Windows Debugger plug-in called LiveKD, created by Mark Russinovich, which implements local interactive debugging in a sense. LiveKD creates a memory dump of the production system on the fly and uses it for debugging.
The Debugging Tools for Windows is regularly updated to support all modern Windows operating systems.
Compuware's SoftICE kernel debugger as part of the DriverStudio software package has traditionally been an alternative to the Debugging Tools for Windows package. A distinctive feature of SoftICE was the implementation of local interactive debugging on supported hardware. The debugger had almost complete control over the operation of the operating system.
As of April 3, 2006, the sale of the DriverStudio family of products was discontinued due to "many technical and business problems, as well as general market conditions." The most recent release of the operating system to be supported is Windows XP Service Pack 2. Typically, service packs do not change the operating system API, but system call numbers and other undocumented information may change. The SoftICE debugger relied on hard-coded addresses of internal data structures. As a result, compatibility was broken with the release of Service Pack 3. Obviously, later versions of the Windows operating system are also not supported.
Syser Kernel Debugger was created by a small Chinese company Sysersoft as a replacement for the SoftICE debugger. The first final version was released in 2007. Like SoftICE, Syser Kernel Debugger is capable of interactive debugging on a running system. Only modern 32-bit editions of Windows are supported.
Currently Windows Debugger is the main tool among kernel module developers. It is also used by the Windows kernel development team.
The debugger is the second thing, after the compiler, to create programs. However, many of those who write computer programs and use a debugger are not aware of the principles and mechanisms of its work.
It's hard being a debugger ...
In light of the fact that programmers use the debugger day and night, especially when they enter deep debugging mode, it is worth saying that if the debugger were not a program, but a piece of hardware, it would probably overheat and break. Because even the compiler does not have as much work as the debugger gets.
Of course, since there are now many different programming languages, then debuggers for each of them are different. And, of course, for different categories of these languages there are differences in the work of debuggers: for example, a debugger for interpreted Ruby programs will work differently than for Java compiled to bytecode, and a debugger for Java, in turn, will have differences from the debugger Visual C ++.
I will talk about debugging for the Windows platform. Having understood the principles of work of debuggers for it, it will be possible to understand both debuggers for POSIX-systems and debuggers that do not work at the operating system level, but at the level of a virtual machine or some kind of interpreter.
Debuggers for Windows: Two Kinds
There are two fundamentally different types of debuggers for Windows. I think everyone was the first to come across when they programmed in Delphi (didn't program in it? It's hard to believe. What did you program on in school and junior years?). These are custom application debuggers. There are many of them, and they exist both separately and (especially, by the way, often) as part of integrated application development environments. OllyDbg is traditionally distinguished among debuggers distributed as separate software products, and I once wrote about it in "Computer News".
The second type of debugger is the operating system kernel debugger. They are found and used less often and differ significantly in their design from debuggers for custom applications. The most famous and, at the same time, the best of the kernel debuggers is SoftIce. Perhaps you have not only heard about it, but even used it.
Since the work of each of the two types of debuggers has its own specifics, I will tell you more about each of them.
Custom Application Debugger
The debugger of custom applications is simpler, since the operating system takes on the dirtiest and dirtiest work. Windows has special programming interfaces for debugging user-level applications - they are called the Windows Debugging API. It is the debugging APIs that all debuggers built into the popular Windows IDEs use.
In order for debugging to start, the debugger must start the process being debugged in a special way so that the system knows that this process will be under debugging. After that, the debugging cycle begins: the program is executed until a certain event occurs, which is called a debug event, or debug event. This runs the debug loop in a separate thread to prevent the debugger from hanging.
But this is just the beginning. Because the most interesting thing in the debugger's work begins already when the debug event has occurred. After all, in essence, what is the job of a debugger? To help the programmer localize the error down to a specific function, specific operation, or specific variable. The operating system can also help the debugger in this difficult task.
So, a debug event has occurred, and then we need to somehow find out how this is related to the program text. This is possible only if the program itself includes special debugging information - a table of debug symbols. It contains information about the correspondence between addresses and function names, data types, code line numbers. It is thanks to them that the debugging with which every Windows programmer is familiar is possible. Symbol tables have different formats, and therefore it is not always possible to debug a program compiled by one vendor's compiler with a debugger from another vendor. But, however, the most common format can still be specified - this is PDB (Program Database), and it was developed, of course, by Microsoft.
So, if the debug symbol table is in the PDB format, then you can use a special tool from Microsoft - the symbolic debug processor. It used to be part of the system kernel and was called Imagehlp.dll, but it was long ago separated into a separate library. The character processor allows you to find the nearest open function or global variable at a given address, as well as the line number and the name of the source file in which this line is located. Inverse operations are also supported, for example, finding the address of a function by its name.
This, of course, is not all the work that a custom application debugger does. For example, when debugging multi-threaded applications, there are many very subtle issues related to the interaction of threads. Even when debugging relatively simple things like services, there are nuances.
But we will not dwell on the nuances now - at the end of the article I will tell you where to read about them. For now, let's take a look at kernel debuggers.
Kernel debugger
Kernel debuggers are much more complex programs than custom application debuggers, and I guess it's understandable why: they don't have an operating system helper. She in this case is their client, because it is her that they, ultimately, have to debug.
Most kernel debuggers require two computers connected by a null modem cable to run. A null modem is a way to connect two computers directly with a cable through their COM or LTP ports. The second computer is needed because the part of the debugger sitting on the first (on the one where the system being debugged) has limited access to the hardware, and therefore all data output goes through the null modem to the second computer.
In modern processors of the Intel x86 architecture there are special debug registers (both in the old 368 and in newer processor models there are only eight of them, they are referred to as DR0-DR7). These registers allow the debugger to checkpoints on memory reads and writes, as well as on I / O ports. In general, everything looks exactly like this, and I don’t think that it is worth describing in detail now what each of the debug registers is responsible for, what interrupts are used to implement breakpoints and give other similar information. I'd rather talk about specific existing kernel debuggers for Windows.
Well, first of all, it is a debugger built into the very kernel of the operating system. It is available in all NT operating systems starting from Windows 2000. It is part of the NTOSKRNL.EXE file and can be enabled by setting the "/ Debug" option for the operating system in BOOT.INI. This debugger needs a null modem connection and a second computer with the same OS.
There is another kernel debugger from Microsoft - WinDBG. Strictly speaking, this is not a kernel debugger, but a hybrid debugger that can be used to debug user-level applications as well. It, in contrast to the debugger built into the kernel, has a graphical shell, and therefore it is easier to use it. This debugger also supports special extensions that can come in handy for some debugging tasks. But it also requires two computers to debug the kernel.
However, there is a kernel debugger that can debug on a single computer. This is SoftIce. At the same time, SoftIce can debug application programs as well. The use of this debugger for user programs is justified, for example, in the case of debugging real-time systems bound to the system timer. If you debug with an ordinary debugger, the result may be incorrect even if the program is running correctly, and SoftIce will stop both the program and the timer. This is useful when debugging multi-threaded applications. In addition, SoftIce has very, very well developed means of displaying information about all threads in the system, about thread synchronization for multithreaded applications, information about handle "ah ... The only drawback of this debugger is its complexity for an application programmer. But from kernel debuggers it is the simplest and most effective.
For the most curious
Now, of course, talking about debuggers for Windows applications is not as relevant as it was ten years ago. The whole world became interested in the Internet, and the main users of SoftIce were crackers, tireless workers in the field of piracy. However, this is not too bad. Communication with SoftIce undoubtedly develops a person in terms of knowledge about the computer, although, of course, if you only communicate with debuggers and do not communicate with real people, some side effects are possible. Well, I think everyone already knows about this.
Debuggers are some of the most distinctive types of software, but in terms of development, even user-level debuggers are quite complex. But, nevertheless, if you have the desire and time to develop your own debugger, your knowledge of operating systems and programming will increase significantly, which means that the chances of a high-paying job will also increase.
So, if you want to create your own debugger, then first you should read the materials on this topic. In my opinion, the best place to start is John Robbins' book Debugging Windows Applications. It is already old, published in 2001, but the information contained in it is still relevant now, since it has a general, even somewhat fundamental character. This book contains examples of writing debuggers for Windows, and is also useful if you program in C ++ and want to better understand exception handling. Actually, it was from this book that I got the information about debuggers presented in the article. If you cannot find this book (after all, it is already quite old), there are several addresses that may be useful to you. The first one is like this: www.xakep.ru/post/19158/default.asp. This article from the magazine "Hacker" tells a little more about kernel debuggers than I did, and in addition, it contains the code of a simple debugger. And at kalashnikoff.ru/Assembler/issues/016.htm you can learn how to write a DOS debugger. But, of course, it's best to read MSDN and find an open source debugger along the way to figure it out. And, of course, if you set about writing a debugger, then success in this difficult task!
To debug the kernel, you need to connect to the computer using a null-modem cable or modem connection. The debugging computer will be named “Host” and the problem computer will be named “Target”.
Both computers must be running the same version of Windows, and the symbol files for the Target computer must be installed on the Host computer. The symbol files are provided on the Windows installation CD in the Support \ Debug directory.
To enable debugging, you must modify the BOOT.INI file on the Target machine.
1. Change the attributes of the BOOT.INI file:
attrib c: \ boot.ini - r - s
2. Edit this file and add the / debug parameter to the Windows startup line (in order to tell the system to load the kernel debugger into RAM when Windows starts). Additional parameters are / Debugport, which tells the system which COM port to use (COM2 by default) and / Baudrate - to specify the baud rate (by default, the baud rate is 19200, but 9600 is better). For example:
multi (0) disk (0) rdisk (0) partition (0) \ WINDOWS = "Windows NT" / debug / debugport = com2 / baudrate = 9600
3. Save the file.
4. Set the previous attributes of the BOOT.INI file:
attrib c: \ boot.ini + r + s
In this example, Target has allowed a 9600 bps COM2 connection.
The Host computer must be configured with the parameters required for debugging. In addition, the symbol files must be installed. To install them, go to the \ support \ debug directory on the installation CD and enter the following command:
expndsym
For example:
expndsym f: d: \ symbols
The installation may take some time. Remember that if service packs were installed on the Target computer, the symbol files for those packs must also be installed on the Host computer. The symbol files for the service packs can be downloaded from the Microsoft website.
The next stage is to set up environment variables necessary for debugging, for example, variables that indicate the location of symbol files, etc. The following is a description of these variables.
Description of system variables
The definition of these variables can be placed in a batch file in order to avoid entering the appropriate commands on each boot:
echo off
set _nt_debug_port = com2
set _nt_debug_baud_rate = 9600
set _nt_symbol_path = d: \ symbols \ i386
set _nt_log_file_open = d: \ debug \ logs \ debug.log
Now you need to copy the kernel debugging software, which is located in the support \ debug \ directory<процессор>on the installation CD (support \ debug \ I386). The easiest way to copy the entire directory is because it is small (about 2.5 MB). For the I386 platform, a debugger is used, which is supplied as an I386KD.EXE file. The debugger is started with the I386KD command. To enter a command, press the key combination